What the dashboard shows
Learn what each tile and card on the Trakr dashboard means, so you can see stock health, recent activity and what needs reordering at a glance.
On this page The four tiles at the top
The dashboard is your morning check. In one screen you see how much you have, what moved in the last day, and what needs your attention.
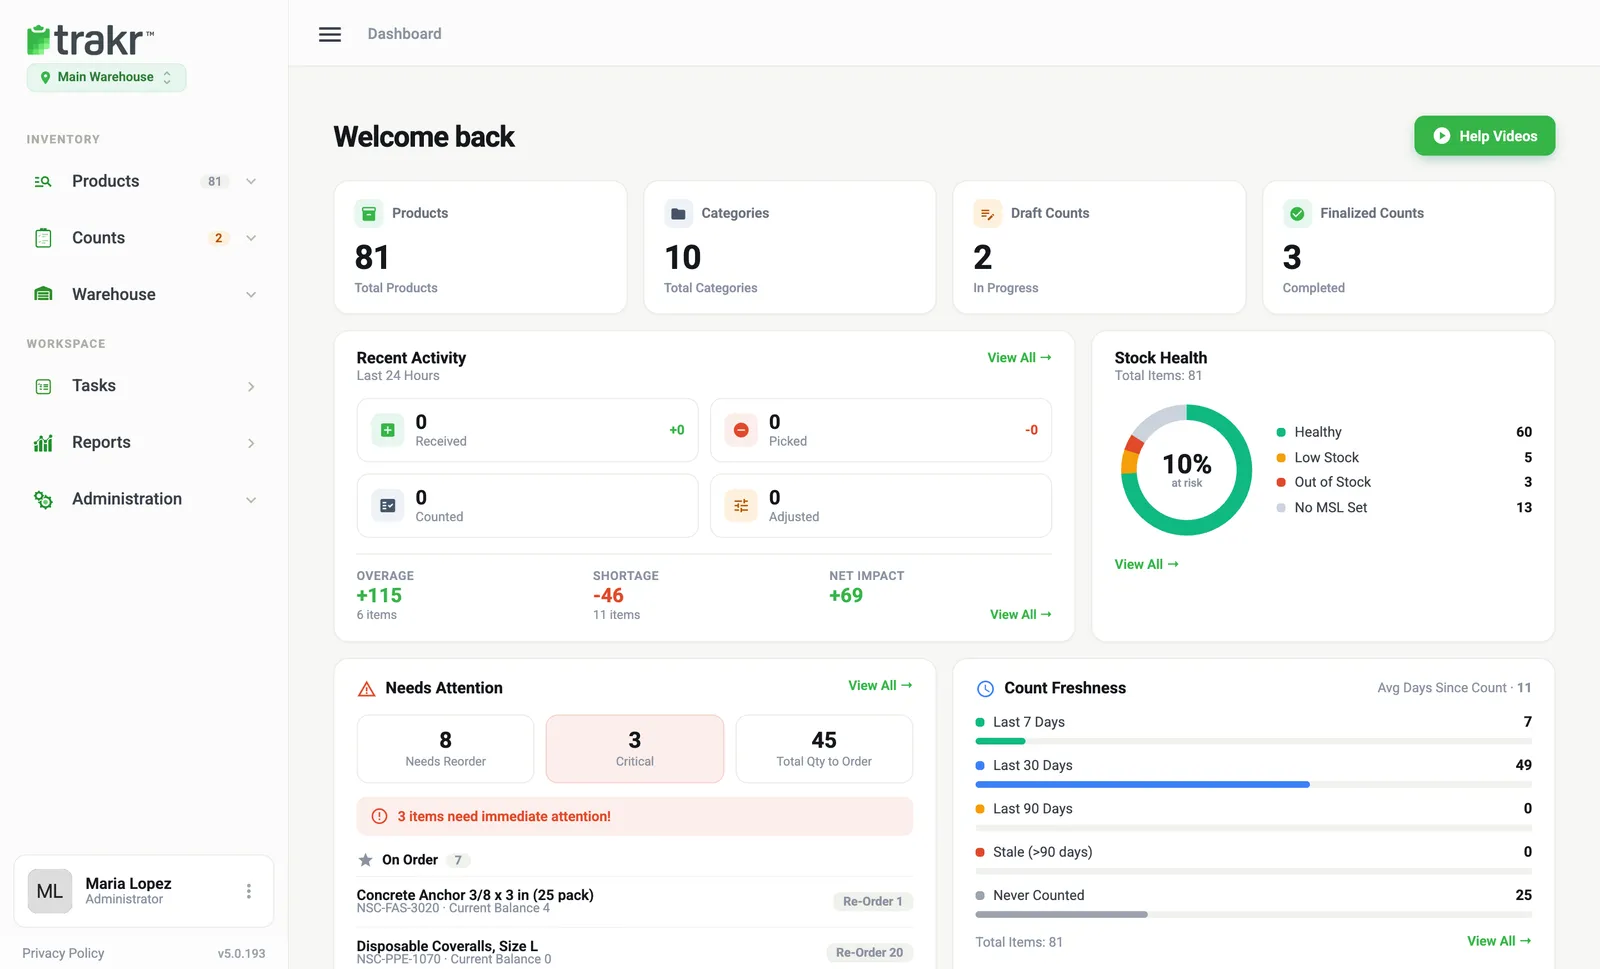
Click the Trakr Inventory logo (top left) or the Dashboard breadcrumb to open it. Everything on the page is for the location shown under the logo, for example Main Warehouse.
The four tiles at the top
Each tile is a shortcut. Click one to open the matching list.
- Products: how many active products you have (81 in the demo).
- Categories: how many categories you use.
- Draft Counts: counts still in progress, waiting for review.
- Finalized Counts: counts that are completed.
Recent Activity
This card covers the last 24 hours. It shows how many items were Received, Picked, Counted and Adjusted.
Below that, Overage, Shortage and Net Impact compare current on-hand with the quantities from your last counts. Click View All to see the detail. The Health Check article explains these numbers.
Stock Health
The ring chart sorts every product into one group:
- Healthy: on hand is at or above the minimum.
- Low Stock: on hand is below the minimum.
- Out of Stock: on hand is zero.
- No MSL Set: the product has no minimum level, so Trakr cannot judge it.
The percentage in the middle shows how much of your stock is at risk. Learn how to set minimums in Set minimum levels.
Needs Attention
This card lists products below their minimum:
- Needs Reorder: products below minimum.
- Critical: products that are out of stock.
- Total Qty to Order: the combined shortfall against minimums.
If you marked products as on order, they appear under On Order with their current balance and the amount to re-order. Open the full list in the Re-Order report.
Count Freshness
This card shows how recently your products were counted: last 7 days, last 30 days, last 90 days, Stale (>90 days) and Never Counted. It also shows the average days since a count.
Other things you may see
- Help Videos: the green button at the top right opens short how-to videos.
- Assets due back: appears only if the Assets module is on.
Common questions
Why does my dashboard show different numbers than my colleague's?
The dashboard shows one location at a time. Check the location name under the Trakr logo. If you are on different locations, you will see different numbers.
Why are some products under No MSL Set?
MSL means minimum stock level. Products without a minimum cannot be marked low or out of stock. Add a minimum to the product to include it.
How do I get back to the dashboard?
Click the Trakr logo at the top of the side menu, or the Dashboard link in the breadcrumb at the top of any page.
Related articles
Was this article helpful?
Thanks, that helps us keep the guides honest. Need more help? Contact us